
2023 Volume Issue 1
July 12, 2023
New Economic Paradigm Associates - Since August 2003
For a downloadable version, click the following:
Monetary-Fiscal Policy July 2023
Thoughts on Current Monetary-Fiscal Policy
The much lauded and cited Modern Monetary Theory has suddenly disappeared from the radar (good riddance). So much for fiscal stimuli - federal spending, not mattering. We have certainly experienced massive demand side inflation (demand pull inflation - too many dollars chasing too few goods). When you couple that with supply side inflation (cost push - supply chain issues coupled with policies like those aimed at curtailing the production of fossil fuels and sidelining the labor force for months on end) it can't help but amplify inflationary pressures.
The Federal Open Market Committee (FOMC) responded to those inflationary pressures by driving up the targeted Fed Funds Rate from 0.25 in March 2022 to 5.25% in May 2023 - 500 basis points. While there is no doubt that the Fed has awesome power in reducing demand pull inflation, cost push (supply side) inflation is also affected, but without policy changes (expanding energy production, getting people back to work), there isn't any long-term impact. The result might well be sticky, residual inflationary pressures.
In short, using FOMC monetary policy to address supply side inflationary pressures is like taking a sledgehammer to an ant. You will get rid of it for the moment, but it will be back as soon as you reverse the policy. After all, you rarely see just one ant.
M2 Growth and collapse - concern?
First, when we're considering at the huge up tick in M2, if you look at in terms of the Covid stimuli; yes, there was a huge injection, but the reality is that with the tapering we're pretty much on the same growth trajectory again. I am not sure what the means, but it might mean that we're back to where we should be … who knows.
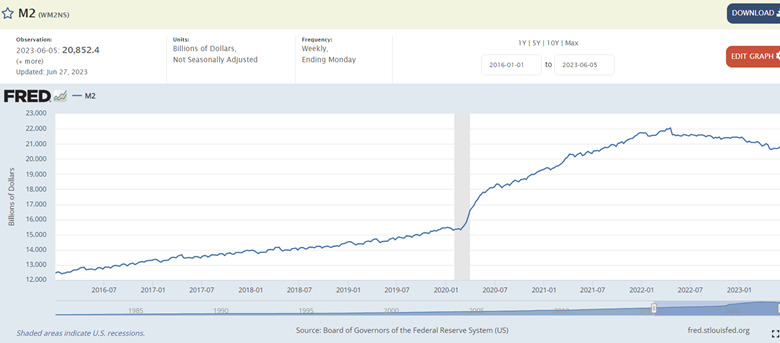
On another note, it's interesting that the FED added savings accounts to the M1 bucket in May 2020. Prior to that time (at least it was my understanding) that if you wanted to make a transaction, you would have to move savings into the M1 bucket (checking).
Federal Reserve Money Stock Measures H.6
[M1 consists of (1) currency outside the U.S. Treasury, Federal Reserve Banks, and the vaults of depository institutions; (2) demand deposits at commercial banks (excluding those amounts held by depository institutions, the U.S. government, and foreign banks and official institutions) less cash items in the process of collection and Federal Reserve float; and (3) other liquid deposits, consisting of other checkable deposits (or OCDs, which comprise negotiable order of withdrawal, or NOW, and automatic transfer service, or ATS, accounts at depository institutions, share draft accounts at credit unions, and demand deposits at thrift institutions) and savings deposits (including money market deposit accounts). Seasonally adjusted M1 is constructed by summing currency, demand deposits, and other liquid deposits, each seasonally adjusted separately.]
[M2 consists of M1 plus (1) small-denomination time deposits (time deposits in amounts of less than $100,000) less individual retirement account (IRA) and Keogh balances at depository institutions; and (2) balances in retail money market funds (MMFs) less IRA and Keogh balances at MMFs. Seasonally adjusted M2 is constructed by summing small-denomination time deposits and retail MMFs, each seasonally adjusted separately, and adding the result to seasonally adjusted M1]
While the Fed doesn't publish monetary aggregates beyond M1 and M2, it doesn't mean that they are not tracking M3, M4, etc. It makes perfect sense that holders of M1 and M2 would move their holdings when the opportunity cost of holding cash becomes excessive.
Fiscal and Monetary Policy - Covid
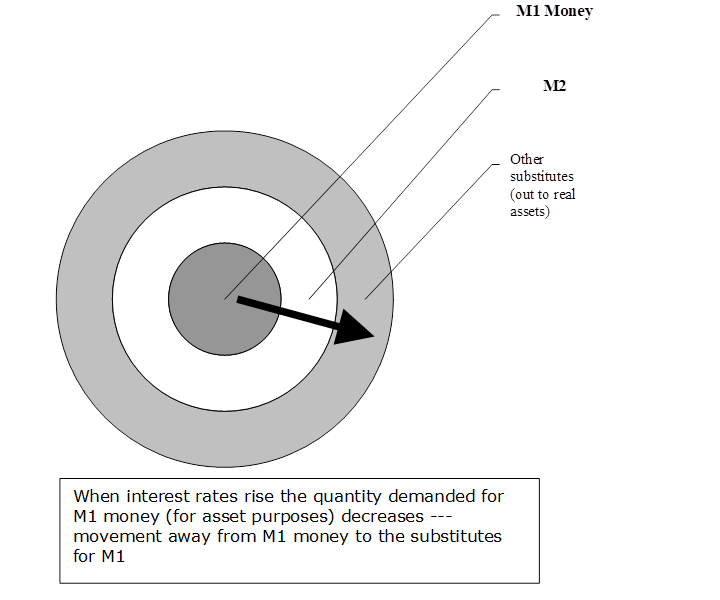
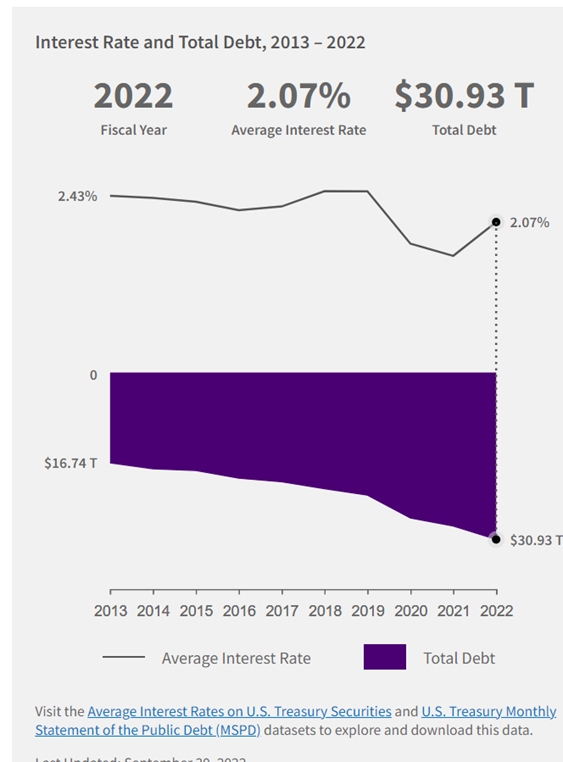
The FED, very similar to what occurred in the late 1970s, remained very accommodative in its monetary policy role [propping up Treasury's borrowing by buying plenty of Treasurys and mortgage-backed securities (MBS)] in the secondary markets, Other substitutes (out to real assets) M2 M1 Money When interest rates rise the quantity demanded for M1 money (for asset purposes) decreases … movement away from M1 money to the substitutes for M1 allowing the fiscal authority (Congress) to stimulate away. The big difference between the Powell Fed and the Volker Fed is that we now have a $32.2 trillion federal debt to contend with. In 2021 fiscal year, the average interest on the debt was 1.6%. In 2022 fiscal year, that increased to 2.07%. I am sure that it is significantly higher now. The longer the Fed maintains the higher Fed Funds Rate, the higher those interest rates will go.
The Fed's balance sheet reflects a reduction of Treasury securities of $618 billion and mortgage-backed securities (MBS) of $174 billion, year over year. The Fed is currently holding $5.1 trillion in Treasury securities and $2.5 trillion in MBS. That all is in line with the Fed’s restrictive monetary policy of setting the targeted Fed Funds rate (5.0-5.25%)
Since the Fed is paying the full 5.25% on reserves, this has drastically reduced their contribution to the government. The Fed 'contributes’ 95% of interest income to the government (tax revenue). In 2021, they paid $109 billion and in 2022 it was $84 billion. This year, that number will most certainly be zeroed out (or lower…negative) in 2023.
Interest on the U.S. Federal debt was $580 billion in 2021 and it rose to $710 billion in 2022. It is on track to top $900 billion in 2023.
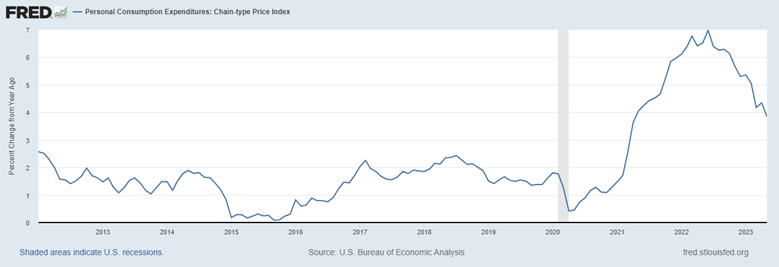
The Fed monitors inflation very closely and its metric of choice is the Personal Consumption Expenditure PCE Chain-type Price Index from the Bureau of Economic Analysis (BEA). It came in at 3.8% in May, down from 4.3% in April.
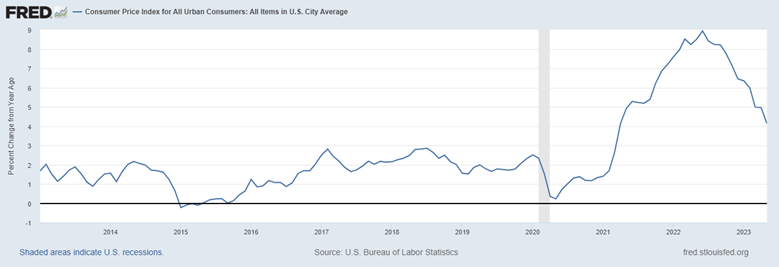
The Consumer Price Index (CPI) from the Bureau of Labor Statistics came in 4.0% in May, down from 5.0% in April.
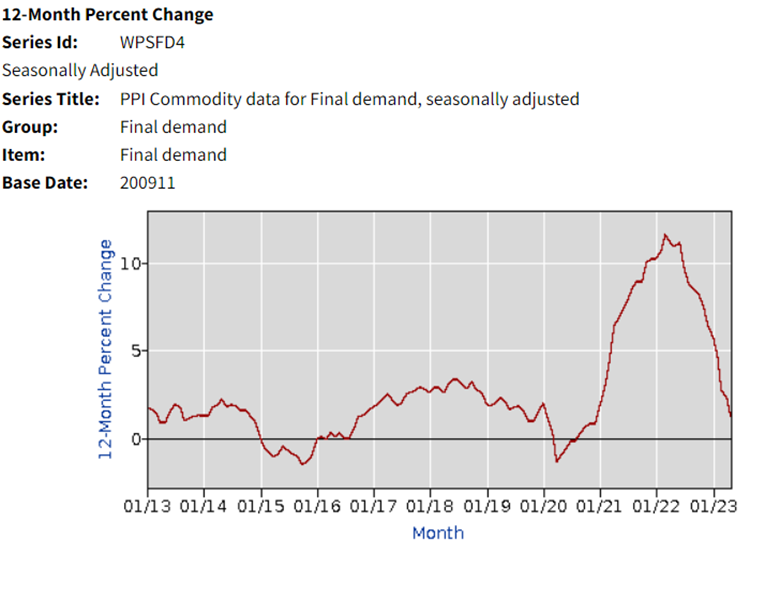
The Producer Price Index (PPI) from the Bureau of Labor Statistics came in at 1.2% in May, down from 2.3% in April.
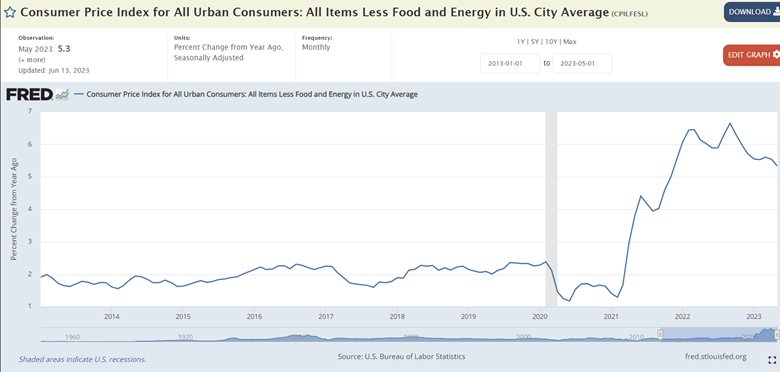
Core Inflation (taking out volatile food and energy) dropped to 5.3% in May, down from 5.5% in April 2023. Still quite a bit higher than it registered pre-Covid (2.4% Feb 2020).
Monetary Policy moving forward - first up: price level changes
There are a lot of moving parts here, but the general consensus seems to be that the Fed will continue to drive up the targeted Fed Funds Rate for a few more rounds, perhaps skipping an increase or two along the way (they meet every 6-weeks - next up July 25). Keep in mind that the Fed mandate for using its monetary policy authority is to monitor/promote/moderate price level changes, employment, and economic growth - the three legs of the macroeconomic stool.
Addressing price level changes is the most relevant concern in terms of the monetary policy/scope of the Federal Reserve. In driving up the targeted Fed Funds Rate - and subsequently all interest rates to one degree or another, this really does a number on borrowers - both individual households and firms and reduces inflationary pressures by slowing down borrowing and hence the economy (demand side). Unfortunately, as mentioned earlier, driving up interest rates also has the 'unintended' consequence of slamming on the brakes on the supply side as well.
Employment
One of the major talking points for the Fed has had to do with the employment picture. They have expressed concerns that with the low unemployment rate - specifically, the U3 Unemployment Rate. My concern about focusing on the U3 Unemployment rate is that it is a very narrow measurement. To be counted as U3 unemployed, you have to be (1) unemployed, and (2) actively seeking employment. Perhaps a more realistic metric would be to go with the U6 Underemployment rate which includes the following:
U-6 Total unemployed, plus all persons marginally attached to the labor force, plus total employed part time for economic reasons, as a percent of the civilian labor force plus all persons marginally attached to the labor force. 6.9% June 2023
U-3 Total unemployed, as a percent of the civilian labor force (official unemployment rate) 3.6% June 2023
https://www.bls.gov/news.release/empsit.t15.htm
Beyond the unemployment rate, we have been paying close attention to the Labor Force Participation Rate for a number of years, pretty much ignoring the 'official' U3 Unemployment Rate.
The Labor Force Participation Rate (LFPR)
Labor Force (LF) = Employed + U3 Unemployed (not employed, but actively seeking employment)
Civilian Noninstitutional Population (CNP) = 16+year not counted in institutional population (military; prison; other institutional settings)
LFPR = LF/CNP
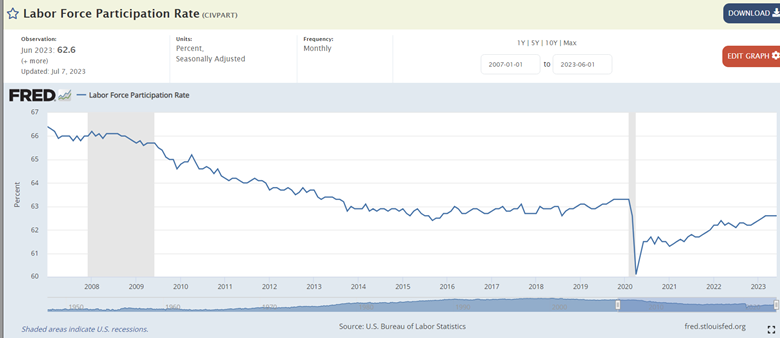
From 2000 - 2007, the LFPR averaged 66.4%
From 2008 - 2018, the LFPR dropped to under 63.0%
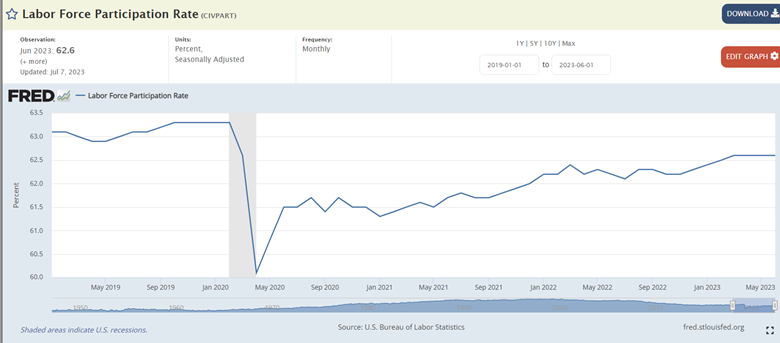
In February 2020, the LFPR was back up to the relatively modest, but climbing 63.3% -- - along comes Covid
In June 2023, the LFPR is at 62.6%
At first glance, by simply looking at the 0.7% differential of 63.3% February 2020 and 62.6% June 2023, that equates to an additional 2 million people on the sidelines, that should presumably in the labor force.
Using 64.0% LFPR, that would equate to nearly 4 million additional on the same sidelines.
The typical argument against the LFPR (why not the 66% rate from the 2000s?) has to do with the large cohort of retirees - baby boomers moving off to their golden years (or, as Dr. Byrne used to call it, the pig in the python).
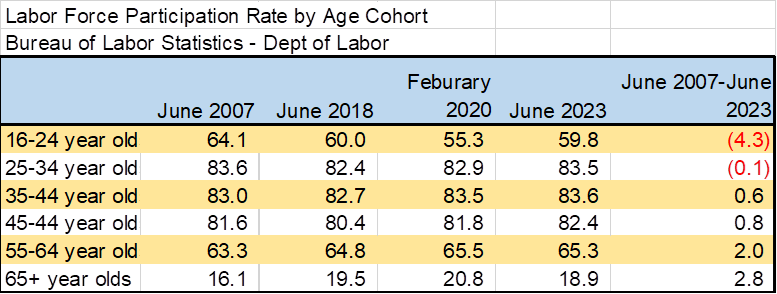
To illustrate this a bit more by drilling down on the various age cohorts, we find that the ages ranging from 16-34 are still below their 2007 Labor Force Participation Rates.
The problem with the 'low' U3 unemployment rate is that it has been typically viewed as bellwether for inflation. Unemployment rates below 4% have typically been viewed as an indicator of wage inflation. The Fed has been quick to point to strengthening labor markets as grounds for continued targeted Fed Funds rate hikes. Again, in my opinion, we still have plenty of room for expansion in the labor markets. Even a return to the February 2020 Labor Force Participation Rate would mean an additional 2 million adds to the employment rolls.
Labor Force Participation Rate by Age Cohort
Bureau of Labor Statistics - Dept of Labor

Latest Snapshot
June 2023 Employment Report
Another great month for the Employment Picture
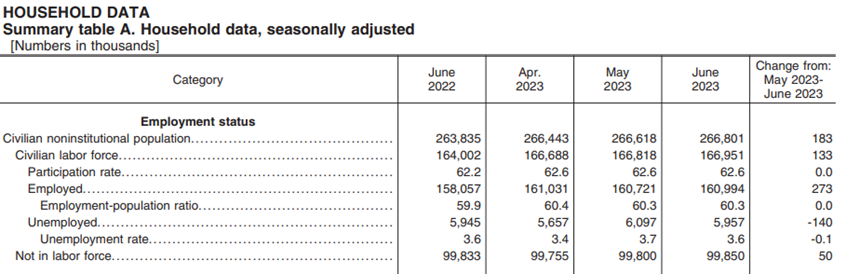
Household Data - Current Population Survey
273,000 added to the rolls of the employed.
140,000 lower unemployed.
Labor Force Participation Rate at 62.6%
Labor Force = Employed 160,994,000 + Unemployed 5,957,000 = 166,951 divided by the Civilian Noninstitutional Population 266,801,000
The good news is that we certainly have room for more growth. Just to get back to our pre-Covid Labor Force Participation Rate (LFPR) of 63.3% would mean that there is room for two million more workers. Even at that 63.3%, there would be room for at least another two and half million workers if the LFPR moved up another percentage point to 64.3%
https://www.bls.gov/news.release/archives/empsit_07072023.pdf
Inflation - further on PCE and Core
So far as the Fed's drive to reduce the inflation rate on the demand side is concerned, they seemed to have accomplished that considering that the CPI came in at 4.0% in May and 3.8% using the Fed preferred PCE (Personal Consumption Expenditure) model from the Bureau of Economic Analysis.
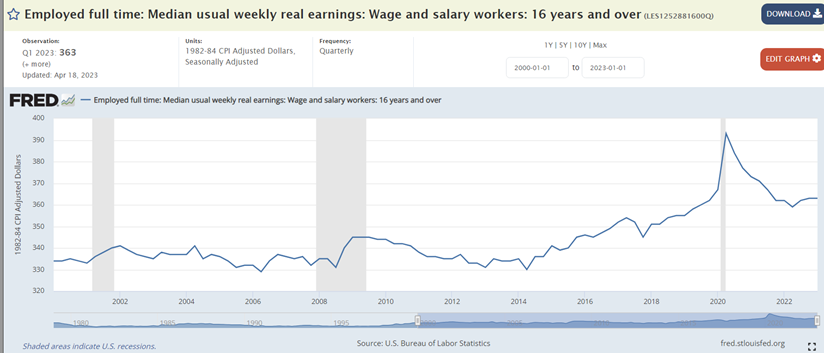
Of course, there is still concern that the Core CPI (5.3% in May 2023) is still pretty high, but that is also trending downward. It's just conjecture on my part, but it's not a stretch to see that a good part of even the core inflation has to do with such things as pass through increases in transportation costs. While not associated with food and energy, those additional costs have to be absorbed the household in the form of higher prices or in terms of reduced compensation to the household as owner of productive resources - most evident with labor, where we've seen reduced real wages.
Economic Growth
So far as economic growth is concerned, near-term, much of it depends upon the Fed's monetary policy of continued targeted Fed Funds rate hikes. Their fear is that if they reverse too quickly, that will only spawn more inflation, but if they persist too long, that could plunge us into recession. The Fed has history of coming to the party too late (accommodating for too long) and staying too long to make up for it (maintaining a restrictive monetary stance for too long).
Fiscal Policy
On the fiscal side, we have a Congress and Executive branch that is unafraid to run massive deficits, in spite of the various cliffs in front of us. Those include the social programs (two-thirds of the federal budget) like Social Security Trust Fund which will zero out in the next ten years (probably less);; Medicare; and Medicaid - which has never been funded. In addition to that, the higher interest rate environment has driven up average interest on the rising $32+ trillion federal debt and will soon top $1 trillion which must be funded from in current and ongoing budgets.
Some good news was that the student loan debt forgiveness did not go through. All that would have happened with that would be for that debt to be tacked onto our ever-expanding federal debt. While that added burden of paying off student debt will reduce the ability of those affected to help grow the economy through purchases, it was good to see some fiscally responsible action (forgiveness pushed by Executive branch) - even if it came from the Judicial branch.
Will the antigrowth policies like added regulation and opposition to domestic energy and mineral extraction persist? I hope not, but that remains to be seen.
In light of this abrogation of fiscal policy responsibility in terms of all of the economic stimuli (spend, spend, spend), the task of stabilization has fallen on to the back the back of the Fed and its monetary policy.
Again, my number one fear with the Fed is that they will stick with their restrictive monetary policy (higher targeted Fed Funds rate regime) until it contributes to crashing the economy. Having said that, I have some confidence that if the Fed is aware of the precarious position the economy is in and should be looking for an exit strategy. There are times when the Fed doesn't telegraph their intentions, so I am crossing my fingers - hoping that this is one of those times. The labor markets have ample room for expansion and the inflation rates have come down significantly. The economy is trying to gain traction, but the high interest rates will only allow so much growth.
Late update July 12, 2023 - more good news. Perhaps this will prevent the FED from moving forward with continued Targeted Fed Funds rate hikes.
Consumer Price Index (CPI) dropped from 4.0% in May 2023 to 3.0% in June 2023
Core CPI dropped from 5.3% in May 2023 to 4.9% in June 2023
