
For a downloadable version, click the following:
September 4, 2023 Word Document
2023 Volume Issue 2
September 4, 2023
New Economic Paradigm Associates - Since August 2003
August 2023 Employment Report - Harbinger of good things to come?

Welcome to the Perfect Employment Report
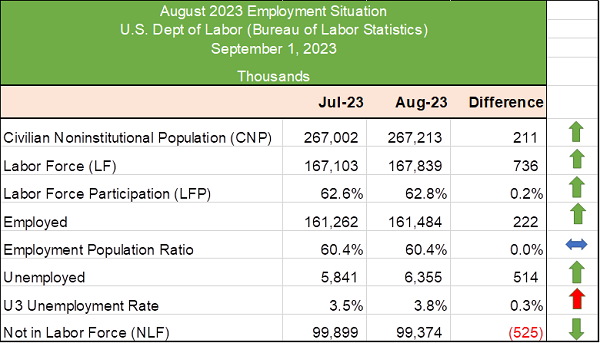
The Civilian Noninstitutional Population rose by 211,000. The labor force (Employed 222,000 + Unemployed 514,000) expanded by 736,000. The Employed grew by a healthy 222,000.
…and now the interesting part. Unemployed number increased by 514,000. Under other circumstances this might set off alarm bells indicating an uptick in layoffs and an economic downturn. Likewise, the U3 Unemployment Rate went from 3.5% to 3.8%;; again, that would typically be indicative of bad things to come.
How can that be considered a positive Employment Report?
Here comes the good news that will temper that increase in the unemployed. The ‘Not in the Labor Force’ component fell by 525,000. What this means is that over half a million people re-entered the labor force. Yes, this drove up the unemployed number, but keep in mind that these people are actively seeking employment and given the fact that there are many jobs to be filled, they will quickly move into the ranks of the employed.
So why am I calling this the perfect employment report? First, despite the rise in the Unemployed by 514,000 and the U3 Unemployment Rate going from 3.5% to 3.8%, the reduction of 525,000 from the Not in the Labor Force is actually a very healthy sign. I am assuming those jobseekers will find employment quickly since the job openings still number 8.8 million, according to the Bureau of Labor Statistics (https://www.bls.gov/news.release/pdf/jolts.pdf) from the JOB OPENINGS AND LABOR TURNOVER - JULY 2023 Report release on August 29, 2023.
Will this be enough to stop the FED from enacting further restrictive policies?
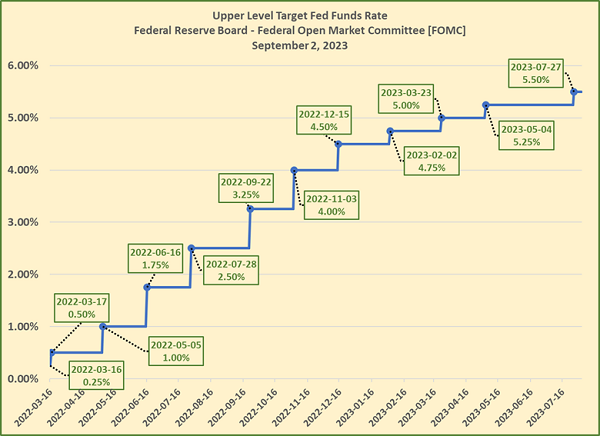
The reason I am finding this report to be so positive has to do with the Federal Reserve’s Federal Open Market Committee, the FOMC. The FOMC is responsible for monetary policy in terms of setting the Target Federal Funds Rate. Starting in March 2022 and going through July 2023 (16 months) the FOMC has raised the Upper Limit of the Target Fed Funds Rate from 0.25% to 5.50%. In a ‘normal’ (what is normal anymore?) world, the FED would have had to sell an enormous amount of its $7.5 trillion portfolio of US Treasury securities ($5 trillion) and Mortgage-backed securities ($2.5 trillion) to drive interest rates up 5.25% over 16 months. Again, this is not a normal environment. Since the FED is paying depositories the upper-limit Target Fed
Funds Rate on reserves (on deposit at the FED or in vault cash), there is no reason for depositories to lend, unless they can get over 5.25% return on loans (plus any associated risk premium). As an aside, borrowing at rates above that 5.25% may well indicated a degree of desperation to prospective lenders.
In driving up the Target Fed Funds Rate (overnight rate that the depositories charge each other), the FED put the squeeze on lending, but also brought tremendous pressure to bear on financial institutions (and anyone else) who was holding US Treasury securities with lower yields. If you were an institution that purchased 30-year US Treasury bonds in January 2022, the yield was around 2.01%. That same 30-year US Treasury bond is currently at 4.29%. The difference is even more pronounced for the 10-year which is currently at 4.18%, while in January 2022 it was at 1.63%.
Who is paying the price for the FED’s 16-month Restrictive Monetary Policy journey?
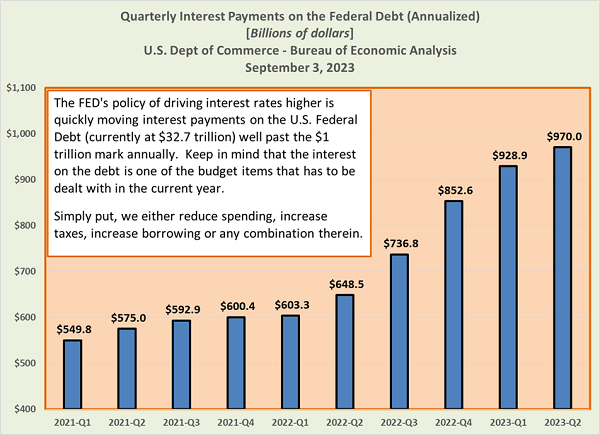
The run up on US Treasury security yields has caused a host of problems for holders of older securities that have lost significant value and for the American taxpayers who have seen the annual interest on the $32.7 trillion (and rising) debt go from under $500 billion annually to approaching $1 Trillion.
In order for the US Treasury to sell its securities (bills, notes, and bonds), they go through the auction process. With interest rates driven up by the FED, this means that the Treasury has to follow suit in order to attract investors to bid on that new issue debt. The higher the interest on that debt, the more the borrower has to pay in interest --- yep, that’s us, we’re paying the price.
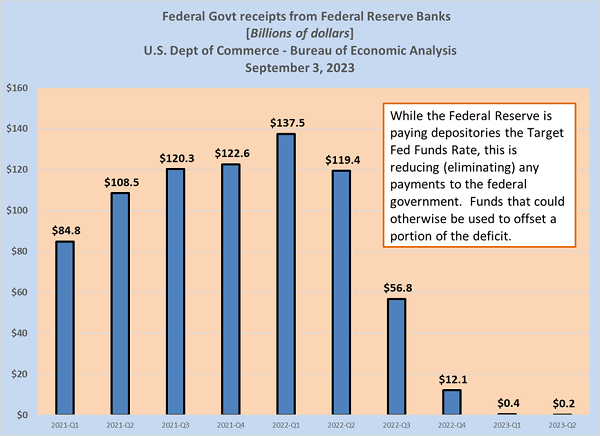
In addition, since the FED is paying depositories to ‘sit’ on their cash (why lend when you can get 5.5% return on cash in the vault or on deposit at the FED), this means that the portion that FED would typically pass on to the Treasury (95% of interest revenue) is going to those depositories and not toward offsetting the current deficit.
What is the FED’s endgame?
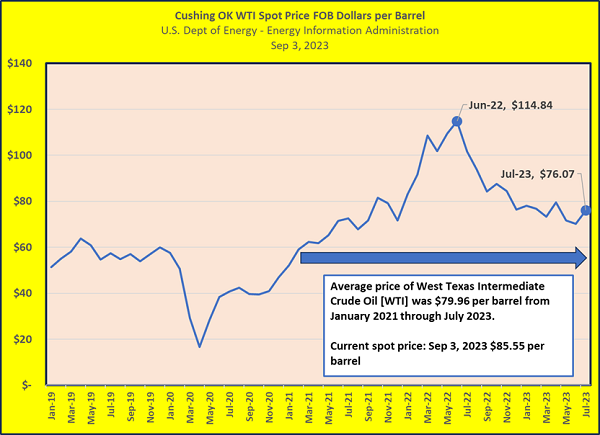
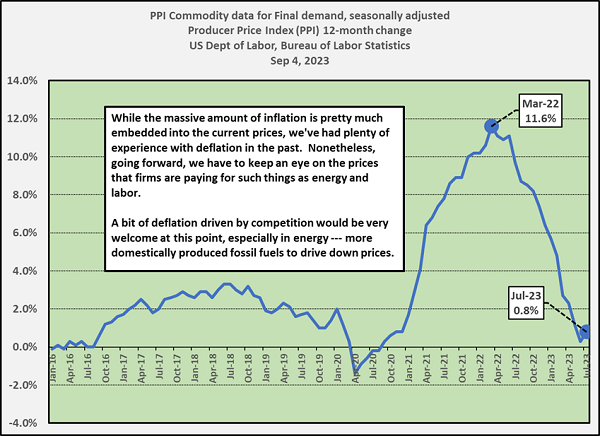
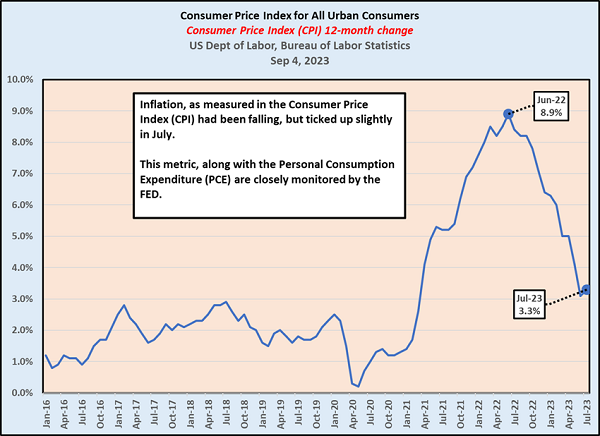
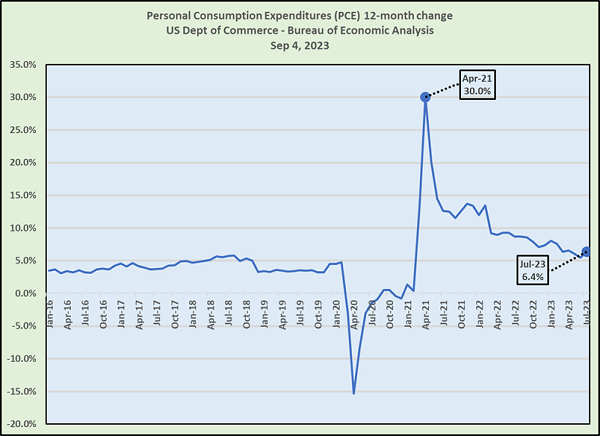
Basically, the FED has been focusing on two aspects of the economy: demand side inflation (too many dollars via stimuli and various types of govt spending) and the supply side as evidenced by higher energy costs and an overheated job market driving higher input costs for firms supplying goods and services to the consumer. The problem is that while the FED’s policies will certainly result in lower inflation (slowing the economy down), it doesn’t really address the supply side issues as evidenced by persistently high fuel prices.
While inflation has been falling in the demand side Consumer Price Index (CPI), Personal Consumption Expenditures (PCE) and the supply side Producer Price Index (PPI), the concern has much to do with the cost already embedded in all of those metrics. The FED is keeping a close eye on all of these metrics, but the reality is that there is not much that they can do aside from driving up interest rates to reduce economic activity (reduce demand).
Back to the Labor Markets
Conventional wisdom points to a direct correlation between the lower U3 Unemployment rates, tighter the job markets and increased wage inflation. From my perspective, the Labor Force Participation Rate and/or the Employment Population Ratio is far more meaningful.
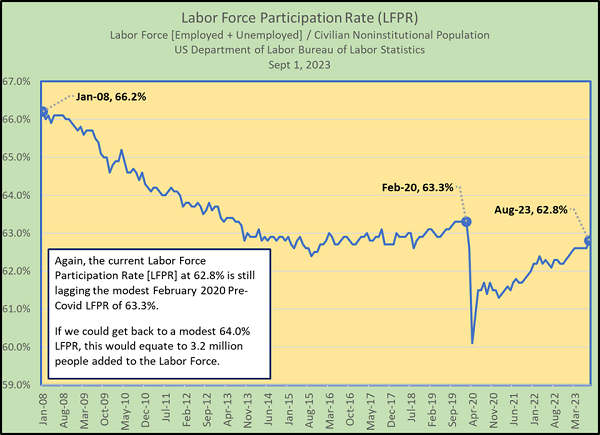
I have been focusing on the Labor Force Participation Rate, the LFPR, for many years. Going back to the mid-2000s, we had 66% LFPR. That rate has fallen significantly over the years and remained well below the pre-Great Recession numbers. Some have pointed to increasing numbers of baby-boomers moving into their golden years and exiting the labor force altogether. While that certainly has some part to play in the falling LFPR, it would make sense that younger cohorts would fill those job slots, at least to some degree.
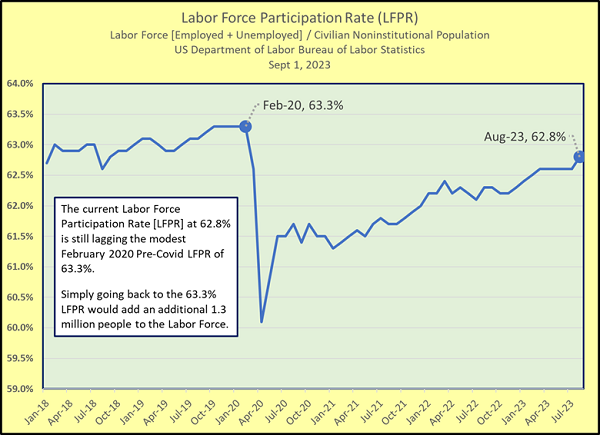
Leading up to the Covid shutdown in March 2020, with an LFPR of 63.3% in February 202, that was the highest LFPR reading since 2013. The takeaway from this is that there is plenty of room for the labor force to expand. In essence, what the August Employment Report points to is that there is ample room for employment expansion. At first glance, the increase of 514,000 in the U3 Unemployment rolls (U3 Unemployment = not employed, but actively seeking employment) can be a scary number, but if we look at it in relation to the reduction in the Not in the Labor Force of 525,000, it paints a far different picture. The reality is that this (net) movement from the Not in the Labor Force into the Labor Force is a very positive indicator. Granted, I am assuming that those folks in the ranks of the Unemployed will find employment, but they are actively seeking employment.
Again, the good news is that Labor Force Participation Rate [LFPR] is on the rise and let’s hope this is a harbinger of good things to come. Keep in mind that there are an average of 200,000 people added to the Civilian Noninstitutional Population, so there is ample room to add more people to the Labor Force. By simply moving back to the Pre-Covid high of 63.3% LFPR, that would amount to 1.3 million added to the Labor Force. Again, spreading that over several months, that number would be much higher.
The reality is that there is no reason why we couldn’t go much higher than the 63.3% LFPR from February 2020. Getting back to the 64.0% LFPR would get us 3 million added folks in the Labor Force.
One last thought, so far as the FED is concerned…the FOMC meets on September 19-20 (they meet every 6-weeks), this is what they have been clamoring for on the labor front. If they persist in driving up, or even maintaining the target Fed Funds Rate, this could very well drive us into a recession.
