
2023 Volume Issue 3
November 5, 2023
For a downloadable version, click the following:
November 5, 2023 Word Document
New Economic Paradigm Associates - Since August 2003
The FED and its Effect on Labor in October 2023
Just a bit of an update focusing on yesterday's Employment Situation Report…there is more to follow, but at a later date.
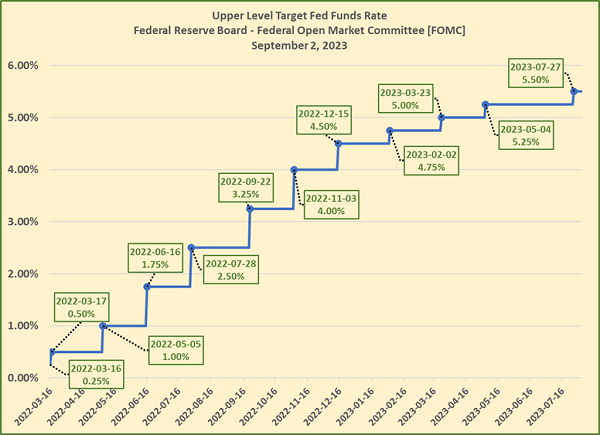
Why the positive reaction on Wall Street in terms stock prices - Dow Jones up 200+points and mortgage rates moderating, dropping below 8% on a 30-year fixed rate? The markets are betting that the FED will ease its position in terms of raising the target Fed Funds going forward due to such things as this latest negative Employment Situation Report and the UAW strike, for another. There are many more factors involved, including - especially, the reality that the FOMC has a track record of overdoing it and has nudged (I am being kind) us into recessions in the past.
Speaking of labor, something to keep in mind is that unionized labor constitutes an ever-shrinking portion of the labor market as a whole, so the fear of significant (further) wage inflation is really unfounded at this point.
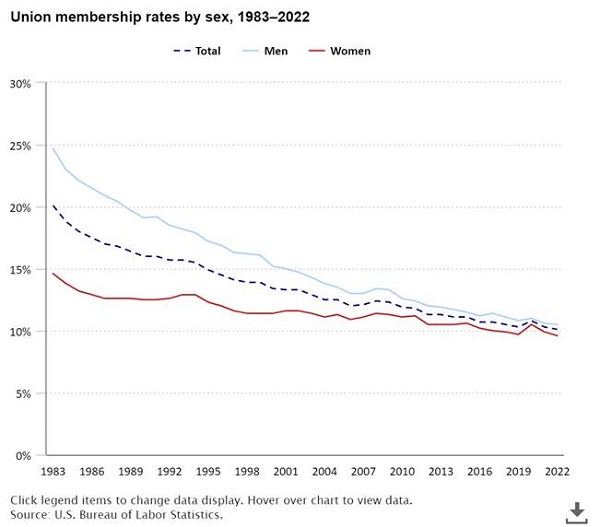
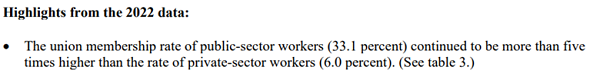
Another point to keep in mind is that public sector workers (government at state and local level) constitute a significantly higher proportion of union labor than their private sector counterparts (i.e., UAW, AFL-CIO, etc.)
U.S. Department of Labor Bureau of Labor Statistics
https://www.bls.gov/news.release/pdf/union2.pdf
Labor Update: 11-4-2023
Nov 3, 2023 Employment Situation Update
https://www.bls.gov/news.release/archives/empsit_11032023.htm
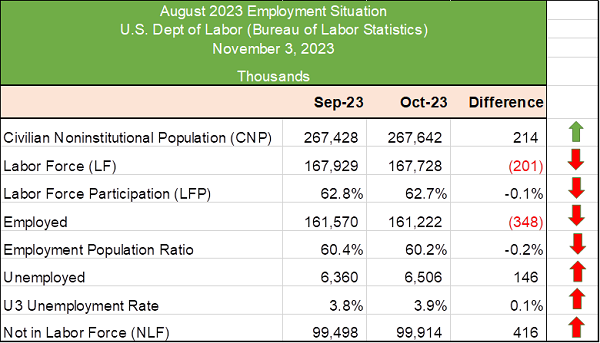
Focus on Table A
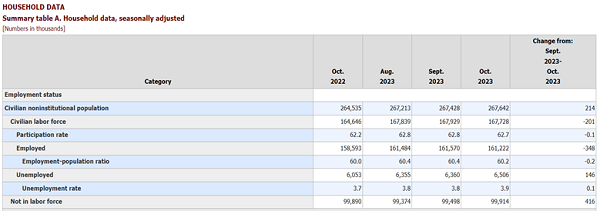
Specifically, you want to look at the far-right column to see the month over month changes.
I typically disregard the Unemployment Rate (this is the U3 or so-called official rate) and instead focus on the other rows.
If we see more net labor force increase, this bodes well, regardless of any change up or down in the Unemployment Rate
Example:
- Civilian Noninstitutional Population = 16+ years of age not counted in institutions (military, prison, nursing homes, etc.)
- Civilian Labor Force increases (that’s a +) Civilian Labor Force = Employed + Unemployed)
- Labor Force Participation Rate (LFPR) increases (another +) Civilian Labor Force / Civilian FYI -Noninstitutional Population
[The Civilian Noninstitutional Population = those individuals 16+ years of age, not in military, prison, nursing homes, or otherwise institutionalized]
Employed increases (that’s a plus) --- this number is from the Current Population Survey or CPS and is a survey performed by the Census Bureau for the Bureau of Labor Statistics (relatively small sample size on the order of 50k, where random households are contacted and asked a series of questions.
- How many individuals are in your household?
- How many of them are 16+ years of age or older (can any members of your household be counted as institutionalized? (Military, prison, etc.)?
- How many of the 16+ year olds are currently employed?
- How many are not employed, but actively seeking employment?
Unemployed (+ or -)
If the unemployed number rises, and those folks frictionally unemployed (between jobs, but not for long), then it’s not a bad thing at all. In this case the unemployed status acts as a way station between the ‘Not in the Labor Force’ category and being employed. The reality is that there are still nearly a 10 million unfilled jobs at the moment.
https://www.bls.gov/news.release/jolts.nr0.htm
JOB OPENINGS AND LABOR TURNOVER - SEPTEMBER 2023
The number of job openings changed little at 9.6 million on the last business day of September, the U.S. Bureau of Labor Statistics reported today.
Unemployment Rate (U3) 1) not employed;; 2) actively seeking employment (+ or -)
- If rate goes up due to more people re-entering the labor force, that’s a good thing…
- If rate goes down due to more people exiting the labor force, not a good thing.
Not in the Labor Force (+ bad / - good)
This represents those people (16+ and not counted in institutions) no longer participating in the labor force (neither employed, nor unemployed seeking employment)
There is more to the labor report of course including the type (quality) of jobs, full-time employment, etc., but this is a relatively easy way to determine what constitutes a good or bad Employment Situation Report.
The takeaway?
No surprise, the FED views this as a sign that its monetary policy of driving up the target Fed Funds Rate as working according to plan.
The latest Employment Situation Report is very troubling to me because it indicates a large increase in folks moving out of the labor force to the tune of 416,000. In fact, all of the movement, month over month, is in the wrong direction (except for the normal monthly uptick in the Noninstitutional Population). The FED will like this data, but I would much rather see more bodies moving back into the labor force.
The bottom line is that the FED will watch for the Consumer Price Index (CPI), Personal Consumption Expenditure (PCE) Price Index, and the Producer Price Index (PPI) data coming out in a couple of weeks. If the CPI (and PCE), in particular moderates a bit, the FED should not opt to raise rates in its December FOMC meeting and should, in my view, start scaling back, to avoid recession…but what do I know.
Again, more to follow…
